All Features
A complete list of our major features – for a closer look, speak to our team about a demo!
General

Notifications
Email, SMS, Voice Call, WhatsApp, Microsoft Teams/Office 365, Pushover, Slack, VictorOps, Zendesk, Webhooks, PagerDuty & OpsGenie.
In The Cloud
No complex or time-consuming server software installation required: RapidSpike runs entirely in the cloud.
Notes
Log any planned maintenance, updates and issues against a website, display your notes on Public Status Pages.
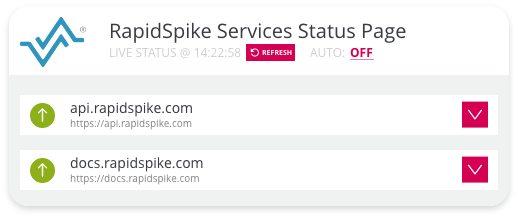
Public Status Pages
Display live monitors from your account on a custom-branded public status page.
User Access Levels
Configure users to have restricted access to monitors in your account: limit what they can see, and what they can update.
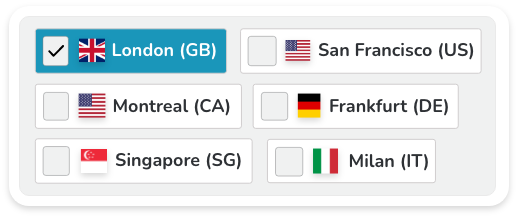
Global Server Network
Monitor from dozens of regions across the world – new nodes available on request.
Maintenance Windows
Pause your monitoring at scheduled or one-off periods to avoid unnecessary alerts.
Dark & High Contrast Themes
Choose from a selection of themes, including accessible modes. Customise your dashboard by choosing from a variety of beautiful scenic headers!
Crisis Escalation
Use rules to escalate server issues to different team members based on length of down-time.
API Access
Connect RapidSpike directly to your stack with access to our API.
Wallboards
View your monitoring data in a series of auto-refreshing wallboards designed for full-screen viewing.
Task Manager
Manage your website strategy and organise tasks by converting insights into actionable fixes. Filter by priority, owner or status.
User Groups
Change permissions, restrict views and manage account access with our customisable user groups.
Third Party Tracking
Extensive third party analysis for benchmarking and assessing third party impact on your website.
Custom Wallboards
Pin live data from websites, user journeys and servers you are interested in to one quick and easy to view wallboard.
Single Sign-On (SSO)
SSO allows for easier account setup and improved account security.
Sitemap Monitoring
Validate the links are functional in your sitemap to ensure customers are not met with 404’s and search engines can rank your pages correctly.
User Journeys
Critical Process Monitor
Monitor essential processes – such as logins, shopping carts, baskets, contact forms etc.
Real Browser Simulation
Select from a choice of real browsers to monitor your website.
Cookie / API presets
Handle popups, set cookies and interact with internal APIs before your user journey even initiates.
Multi-region
Run journeys from any continent/country to test your application from all around the world.
Video Playback
Records video of your Journey so you can see exactly when and where issues occur.

Geo-mapping IP Addresses
See your site resources in a global view, with highlights for slow loading elements.
Performance Thresholds
Set load time thresholds per journey, per region, to get dynamic alerts based on performance.
Error Detection
Receive notifications for both journey failures and errors caused by any on-page element.
Third Party Tracking
Track your third party plugins, see which ones are performing well and which ones are underperforming.
Basic Auth
Access authenticated parts of your platform by sending a username and password.
Benchmarking
Use RapidSpike to benchmark and understand key processes of your application.
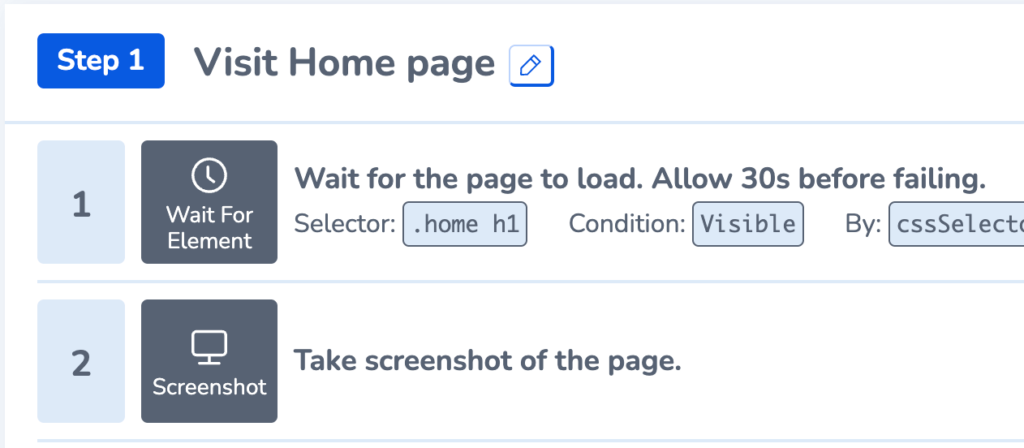
Self-Service
Create your own Journey scripts using our simple builder, or work directly in JSON-format instructions.
Visualise Key Processes
We auto-generate screenshots during each key step of your user journey.
Cookie Logs
Helps you comply with GDPR by logging all cookies discovered during the Journey.
Block and Ignore List
Block/Ignore files from your Journey results to avoid skewing your internal monitoring and stats.
Managed Service
Enlist our technical account managers to help write and maintain your scripts and translate the results.
Resource Waterfall View
View full details of all page elements, including load times, request and response headers.
Reports
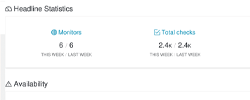
Executive Reports
Custom reports designed specifically for management, with top-level metrics and other useful data.
League Tables
Organise your websites or servers into a monthly league table report.
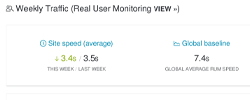
Scheduled Reports
Configure your own regular reports delivered to addresses of your choice.
Filters
Comprehensive filters allow you to compare specific websites or servers.
Date Comparison
Compare different servers or websites over specific time periods.
Printer Friendly
Reports are designed to use a printer friendly layout.
Raw Data
Download full data logs in CSV format.
Performance Monitoring
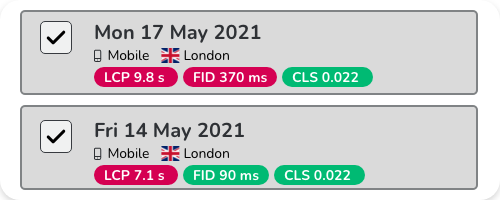
Global Regions & Multiple Devices
Check your website performance around the world with our global regions. Also see how it performs on different devices.
Track Performance in Real-time
Detailed graphs showing your sites LCP, FID, CLS, Speed Index & Server Response Time (TTFB).
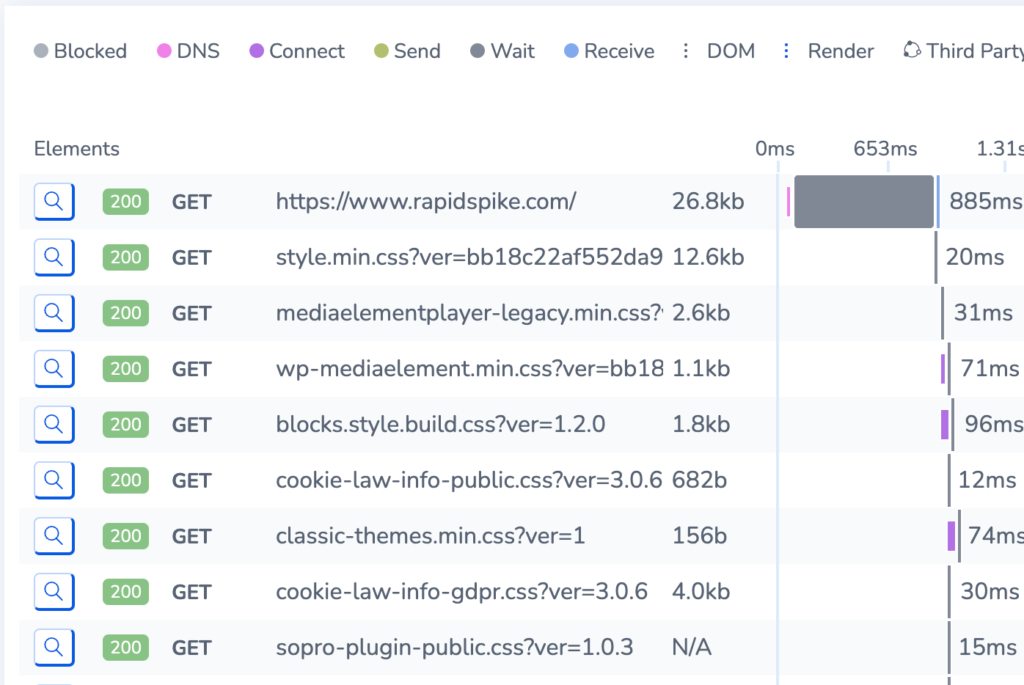
Deep Performance Analysis
Deep dive into your waterfall, track errors and alerts, see where your site visitors are coming from & view your tracked elements.
Monitor Your 3rd Parties
Measure your 3rd party performance impacts, errors and issues easily. Minimise disruption for you, your operations team and customers.
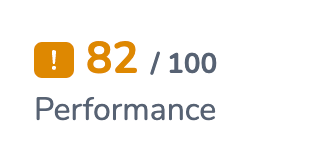
Google Lighthouse Audits
See how your website ranks with audit tests on Performance, Progressive Web App, Accessibility, Best Practices, and SEO.

Chrome User Experience Report (CrUX)
See how your site performs in field data (CrUX) over time.
Google Analytics Integration
Benchmark changes to website performance metrics against Google Analytics data such as page views and bounce rate.
Device Emulation & Connection Throttling
Emulate key customer profiles by setting device types and throttling connection speeds.
Security

SSL Cipher monitor
Track your SSL Cipher, get alerted on any issues and receive a grade for the cryptographic connection strength.

Magecart Attack Detection
Defend against MageCart, data-skimming and form-jacking attacks. Track hosted and third-party Javascript on your website for data breaches.
Google Safe Browsing monitor
Tracks the Google Safe Browsing list, which monitors sites for malware, social engineering, phishing, and so on.

CMS Scanning
Vulnerability Scans optimised to look for vulnerabilities in major Content Management Systems. Including: WordPress, Drupal, SilverStripe, Joomla and Magento.
Security Headers
Our Security Header scanning capabilities allow you to review your homepage’s performance, receive a ranking based on a number of factors, such as: Strict-Transport-Policy (HSTS), Content-Security-Policy (CSP), Feature-policy / Permissions Policy
Reliability
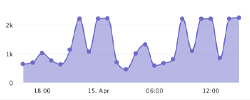
Highly Configurable
Comprehensive global uptime monitoring network for checking server, api and web page uptime.
Uptime Sensitivity
Set intervals as low as 1 minute and up to 1 hour.
Response Timeout
Set a timeout for your monitors after which we will mark them as failing.
Basic Authentication
Add a username and password and access pages behind basic authentication.
API monitoring
API monitor that enables endpoint uptime and response checking via PUT, POST and DELETE.
Content Checking
Check your pages for specific content, and alert if it appears (or does not appear).
In-depth Data
View logs of incidents and response times graphs on a granular per-monitor basis.
Root-cause Analysis
Determine why certain errors occurred with automatic traceroutes, nMaps and other diagnostic tools.
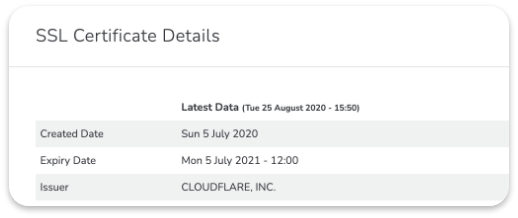
SSL Monitor
Independently monitor your SSL Certificate and receive notifications of your upcoming expiry.
Domain Redirect Monitor
Ensure your HTTP to HTTPS domain redirect is correctly configured.
Domain Name Monitor
Monitor your website domain name WHOIS and get notified of any changes and your upcoming expiry.
Enterprise-ready Alerts
Escalate issues by team, department, region or contact method. Choose who and how people are notified of critical issues.
SEO Statistics
Track your ongoing SEO scores on a number of metrics, including page links and domain MozRank.
