Page Load
A powerful reliability and performance tool, Page Load grant you the ability to monitor your pages with more detail than ever before.

See how it works:
The Ultimate Page Monitoring Tool
By rendering your page in a real browser, Page Load monitors not just your page, but every element on your page – scripts, images, fonts and all.
Fully configurable
Utilise a global testing network, test at a frequency to suit you, choose the browser, add basic auth and customer headers
Complete HTTP Archive
Learn how your pages load by seeing a full waterfall view of elements as they are downloaded
Highly advanced alerting
Set up detailed alerts triggered by slow loading or oversized elements
Providing Critical Information About Your Site
Page Load Tests provide critical and important information about your website. Track your elements and see what is slowing you down.
Detailed Waterfall
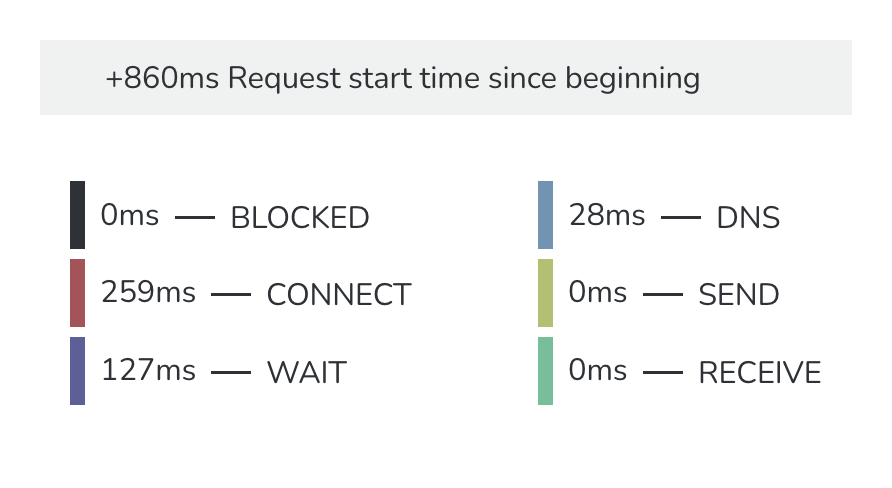
The Page Load Test tracks every element downloaded, and provides you with a full breakdown of event timings, request and response headers to explore.
Identify your performance issues in granular detail – find blocking or slow elements, server or network problems, element errors and failures.
Sort and reorder the list of elements loaded to view by speed or URL, and filter to view specific domains.
Cookie Logs
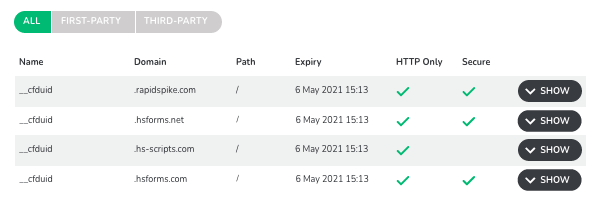
Meet GDPR requirements by listing all cookies stored and used on the page. The Page Load Test will identify all first and third-party cookies and list them for you, along with their settings and values.


Benchmark Page Load
You can’t manage what you can’t measure – use the Page Load Test to understand what normal page load looks like. Use this benchmark to set your tolerance threshold for future alerts.
If the page is slowing down there is probably a valid reason. The Page Load test allows you to set performance thresholds so that changes in page load can be highlighted.
Page Screenshots
View your site screenshots after each Page Load Test, so you can verify it has loaded successfully. You can also customise your viewport size for the screenshot. This can be used for simple mobile emulation to trigger media queries and change the presentation of your page.

Uptime versus Page Load
Uptime is the core test that checks for a page’s availability. Page Load does something much more complex: it loads the entire page in a browser, rendering and storing the details for every file it encounters (creating a “HTTP Archive” file).
Deep dive into page failures and root cause analysis.
Understanding individual element performance.
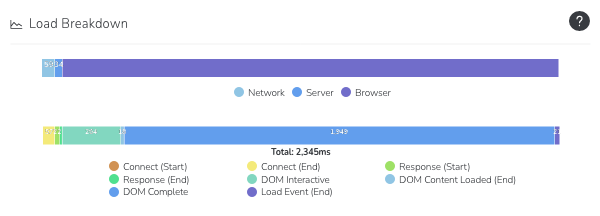
Trending overall page speed via DOM and Render.
Tracking third parties for performance, size and their affect on page load.
View & audit cookies to meet your GDPR requirements.
Visualise page load and failures with screenshots.
Follow The Action

Track Third Parties
See which third party tools on your site have the largest overheads – both in terms of file size and load time.
Monitor your add-ons to identify which need replacing or might be causing performance issues for your customers.
The Page Load will automatically group elements loaded from the same domains – so you can view combined as well as separate stats for each 3rd party file.

Element Trending
Draw out your critical elements – such as hero images, stylesheets and critical javascript files.
See how these key files change over time – track and monitor how load time and size fluctuates as you release new updates.
You can also suppress alerts from certain files – or block them from your data completely.

IP Map
View every element loaded during the Page Load geo-located onto an interactive world map.
Easily identify the source locations of your entire page – a fantastic way to quickly determine the source of poor performance due to DNS and routing. Each location pinned on the map will include all files loaded and their load times.
