Shining new light on your website performance
One of the features we love about RapidSpike is the sheer amount of data we collect about the performance of our customers’ websites. We are able to use this data to provide great insight into real user experiences and, crucially, how to improve those experiences. However not everyone has time to analyse that data, or knows exactly what to look for.
Many of our users are also required to send reports to their key stakeholders on their website performance and availability to ensure everyone has an understanding of the challenges of maintaining a great website.
Packaged in a single deliverable PDF, we’re pleased to announce the new Weekly Activity Report.
What does it include?
The Weekly Activity Report includes a wealth of information using a wide variety of different monitoring metrics. All the data is linked back to your RapidSpike account where you can investigate in more detail. After week one, each new report will compare to the previous week to give you a way to analyse trends in your data. “Version One” of the report includes:
- Overall headline statistics – Monitors, checks and alert counts
- Availability – Your uptime, our global baseline and your availability RS Score
- Assurance – WhoIS expiry, SSL Expiry and Cipher
- Real User Monitoring – Site speed (with RS Score), Weekly and best day traffic graphs with browser, country and device breakdowns
See how you compare
The new report also includes your first look at two new metrics: RapidSpike Baseline and RapidSpike Score.
RapidSpike Baseline is essentially a “global average”, which we calculate using wide variety of sources, including: our team’s expertise on testing and performance, averages from all RapidSpike users and stats from the wider internet. RS Baseline is therefore a universal metric which you can measure yourself against.
RapidSpike Score will be implemented throughout the RapidSpike app in the coming months. With this score we are starting to grade each type of website interaction – from A+ down to E. This ranking enables you to track continuous improvement – hopefully resulting in a boost to revenue, conversions, and also a reduction in power consumption which helps the environment.
RS Score also utilises the RS Baseline to help you understand where you are positioned against others. You can read more on RS Scores here.
How to configure the report
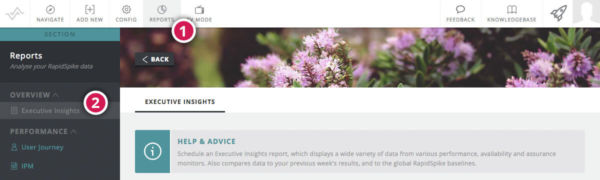
Firstly, click on “Reports” in the main menu (1), then on “Weekly Activity Report” in the lefthand menu (2).
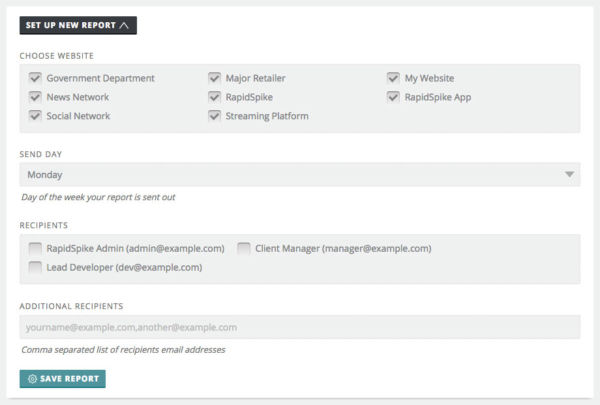
Click “Set up new report”, then choose which website(s) you wish to include, what day of the week to receive the report, and who you would like to receive it.
What happens next?
Initially, the reports are designed to run weekly but we are looking at daily, monthly and even quarterly report durations. “Version Two” (which is not far away) will include all the data from Intelligent Page Monitors including element counts and sizes, your “worst offenders” (images, js and others), plus trip duration (geo-tagging).
To make adding a new website even easier we’ve also added a quick add functionality that creates all the monitors you need to give you this initial insight. Just click “Add New”, in the main menu, and then choose “Simple” mode.
About RapidSpike
RapidSpike helps secure, understand & improve online business by capturing, aggregating, & analysing multiple data sources to provide key insights about your digital platforms & your real user experiences.
RapidSpike also improves stakeholder visibility by monitoring system performance, availability & reliability, assessing security vulnerabilities and using synthetic monitoring alongside real user experience data to alert you to real-time issues.
RapidSpike brings you visibility, understanding, and clarity enabling better decision making which will keep you online & secure, enhance your user experiences & improve revenue conversion which helps you gain a competitive advantage.