Reliability Monitoring

Monitor web pages, servers, ports and key processes with robust, frequent checks.

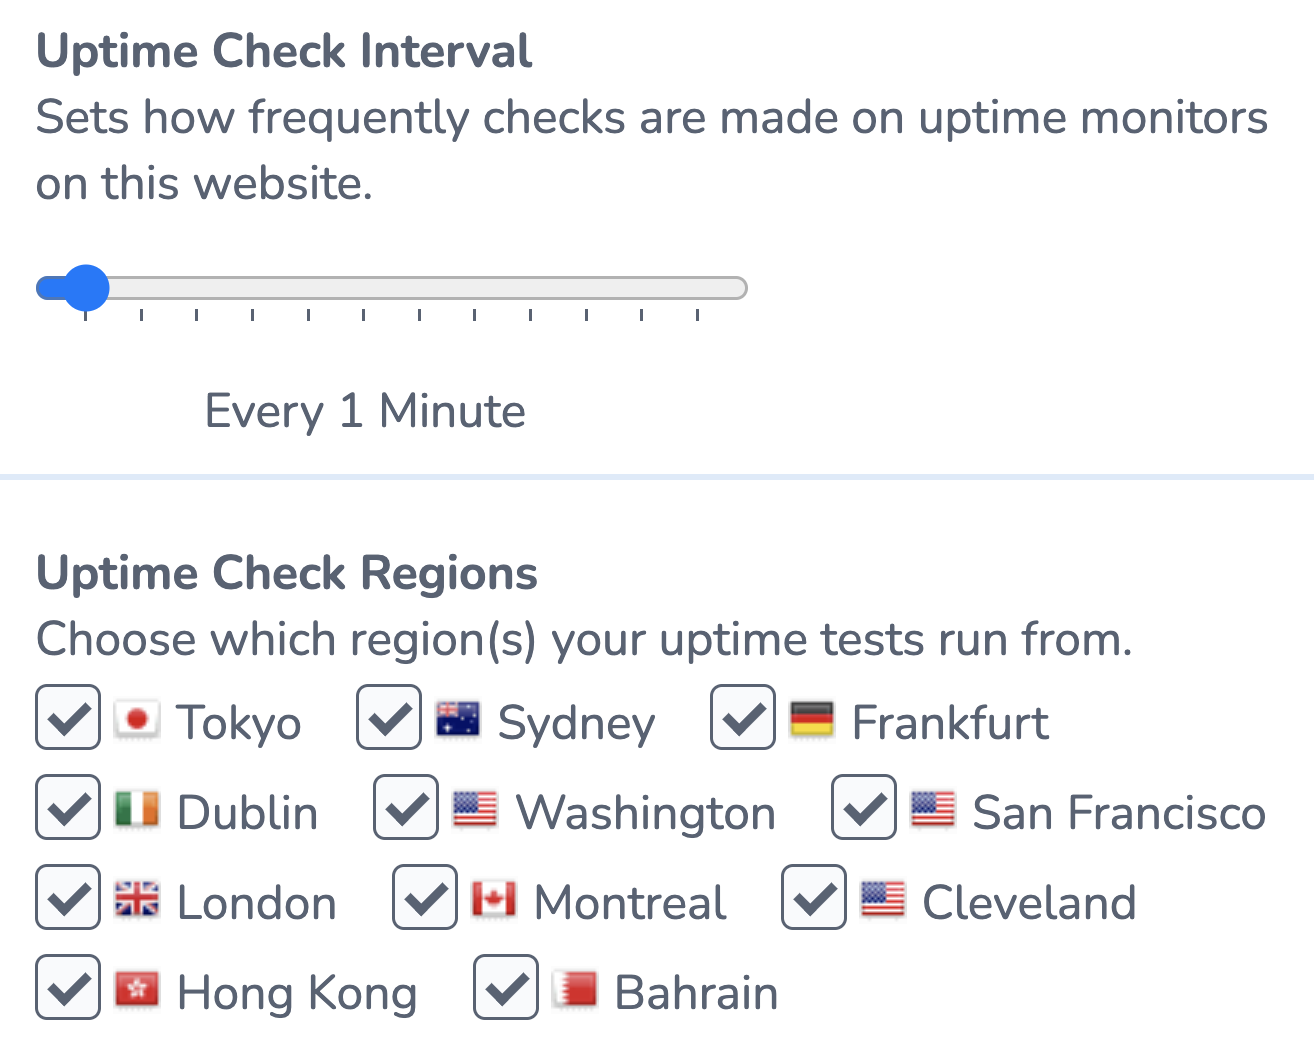
Monitor your availability minute by minute, from anywhere in the world, 24/7.

Debug downtime with root-cause analysis tools whenever an issue occurs.

Trigger alerts through a wide variety of industry-standard integrations.

Stay Up and Keep Customers Shopping

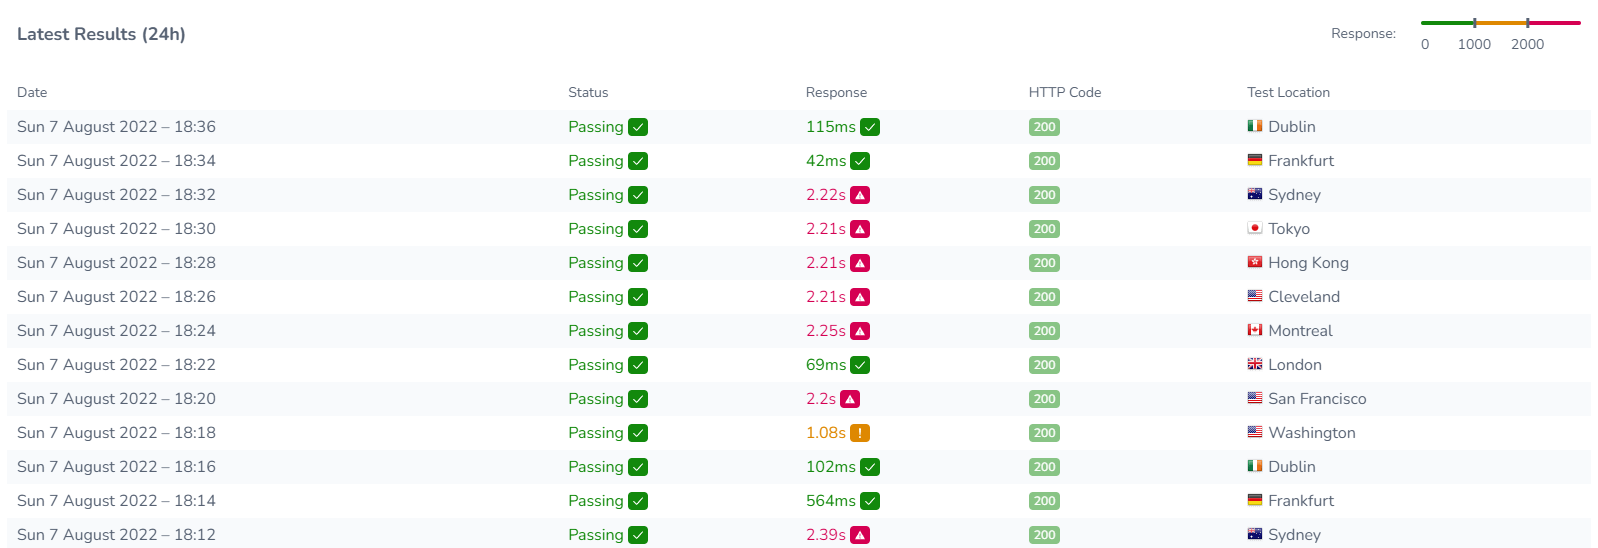
Minute by minute global uptime checking from over 70 locations with root cause analysis.

Detect and alert on failing website pages or servers in a matter of moments. Comprehensive and robust uptime monitors from RapidSpike can check your site every minute of every day. 

Our monitors also track availability metrics, check your pages status code and response time. They can even check if specific content exists (or doesn’t exist), and perform root cause analysis of errors. 

Load Graph

Watch Your Customer Journey Issues in Real-Time

User journeys are a performance, security and uptime tool all in one.

Quickly and easily write scripts without writing any code to navigate your website just like a customer does. Our synthetic monitoring will then deep dive into every single third-party call, check for errors and performance issues, element sizes and speed and much more.

Synthetic monitoring can even detect potential web skimming attacks by scanning all host information and data sent during the journey.

A Watchful Eye on Your Website

Even the smallest of errors can be devastating.

Check domain expiry via WhoIs, Google Safebrowsing, SSL Certificates, SSL Cipher Score, Security Headers and more. Ensure your website can’t be hijacked by missing something simple. Get alerted immediately if an error or configuration issue appears in your website perimeter.

Security Headers Issues
Reliability - performance waterfall

Errors: Bad for Business and SEO

Detect issues realtime, check 3rd parties and debug issues.

Errors at any time can intermittently cause your customers and your organic SEO problems. This monitor downloads the entire page – including every element, script, cookie, image and third parties – so you can analyse and review the data in fine detail. 

We check everything from initial connection, how long it takes to load all the webpage content, to an interactive DOM.

Check for Invisible Issues

Check your APIs are responding how they should.

Your website may look okay but APIs could be the key to improving your user experience.

Monitor your API endpoints with an HTTP, GET, POST, PUT or DELETE monitor.

Check your API is live, responding correctly, and returns a response time. Query your API by sending a request body, specify an expected response – and check for an exact match or if the response contains a certain value.

Reliability - request & response
Reliability load graph

Connect ANYTHING!

In an increasingly complex world, connect anything does what it says it does.

Monitor any internet-connected source, server or device with a custom monitor. Connect Anything allows you to send any monitoring data to RapidSpike and to utilise our sophisticated alerting system to trigger alerts based on set values. 

Once you have configured the device in your RapidSpike account, you’ll be able to see dashboard data and to create reliability alert rules based on the values you receive. Speak to us about configuring a Connect Anything monitor in your account.

Insights Into Your Reliability Data

Insights is an intelligence engine that processes your data and produces clear
actionable tasks for you to work on, organised by urgency.

Understand and prioritise what to fix

Track areas where your platform reliability can improve, and manage progress with a clear priority list.

Things you can do better

Celebrate when you are winning

Keep ahead of competitors by understanding where you are performing well (and how).

Things you do well